quick start
This document will get you started quickly with Scaleda.
Install

💥Note: Currently, Scaleda has not verified compatibility with other plug-ins that support HDL language. Please do not install and use other HDL language support plug-ins at the same time.
Refer to the document Installing Scaleda.
Create project
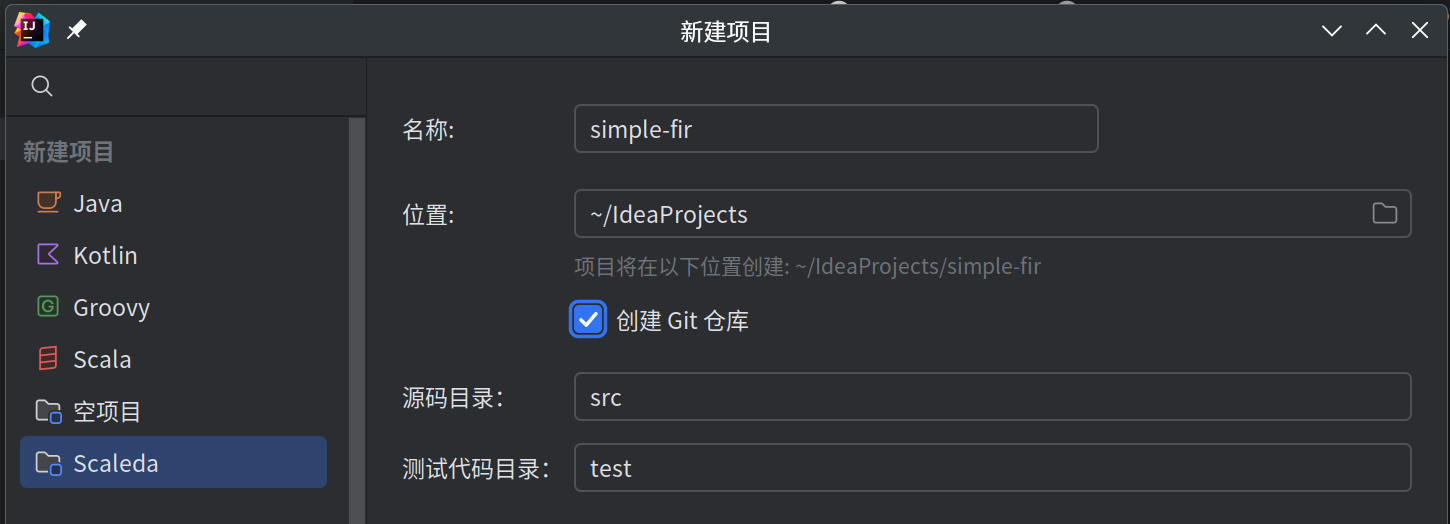
创建新项目
File → New → Project → Scaleda. Please refer to Project Management for details of the two parameters here. Just keep the defaults here.
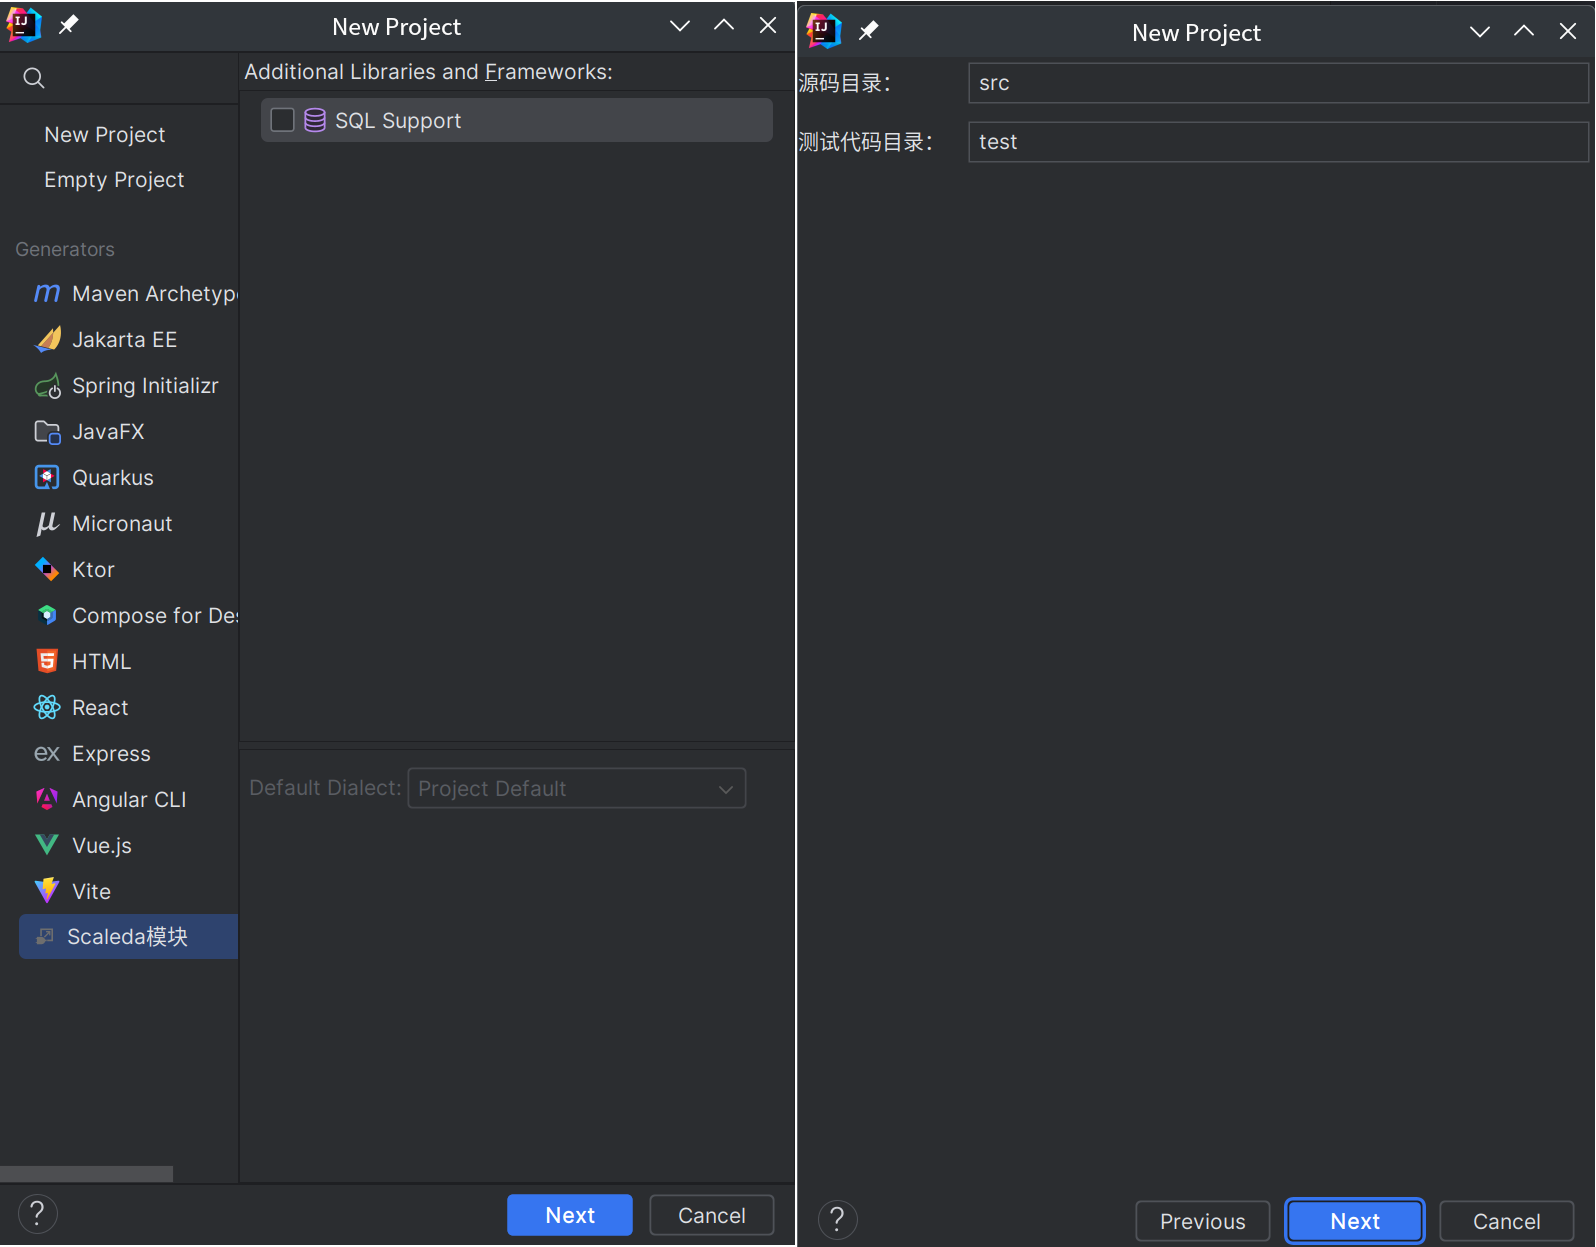
If there is no Scaleda under “Project”, you can create a project in “File → New → Project → Generator → Scaleda Module”, or use the CLI tool.
At this time, two empty folders and the project configuration file scaleda.yml are created, with the following contents:
---
name: simple-fir
type: rtl
source: src
test: test
从已有代码创建项目
If you already have HDL code, you can directly create a scaleda.yml file and configure the project path parameters according to Project Management.
Writing HDL code
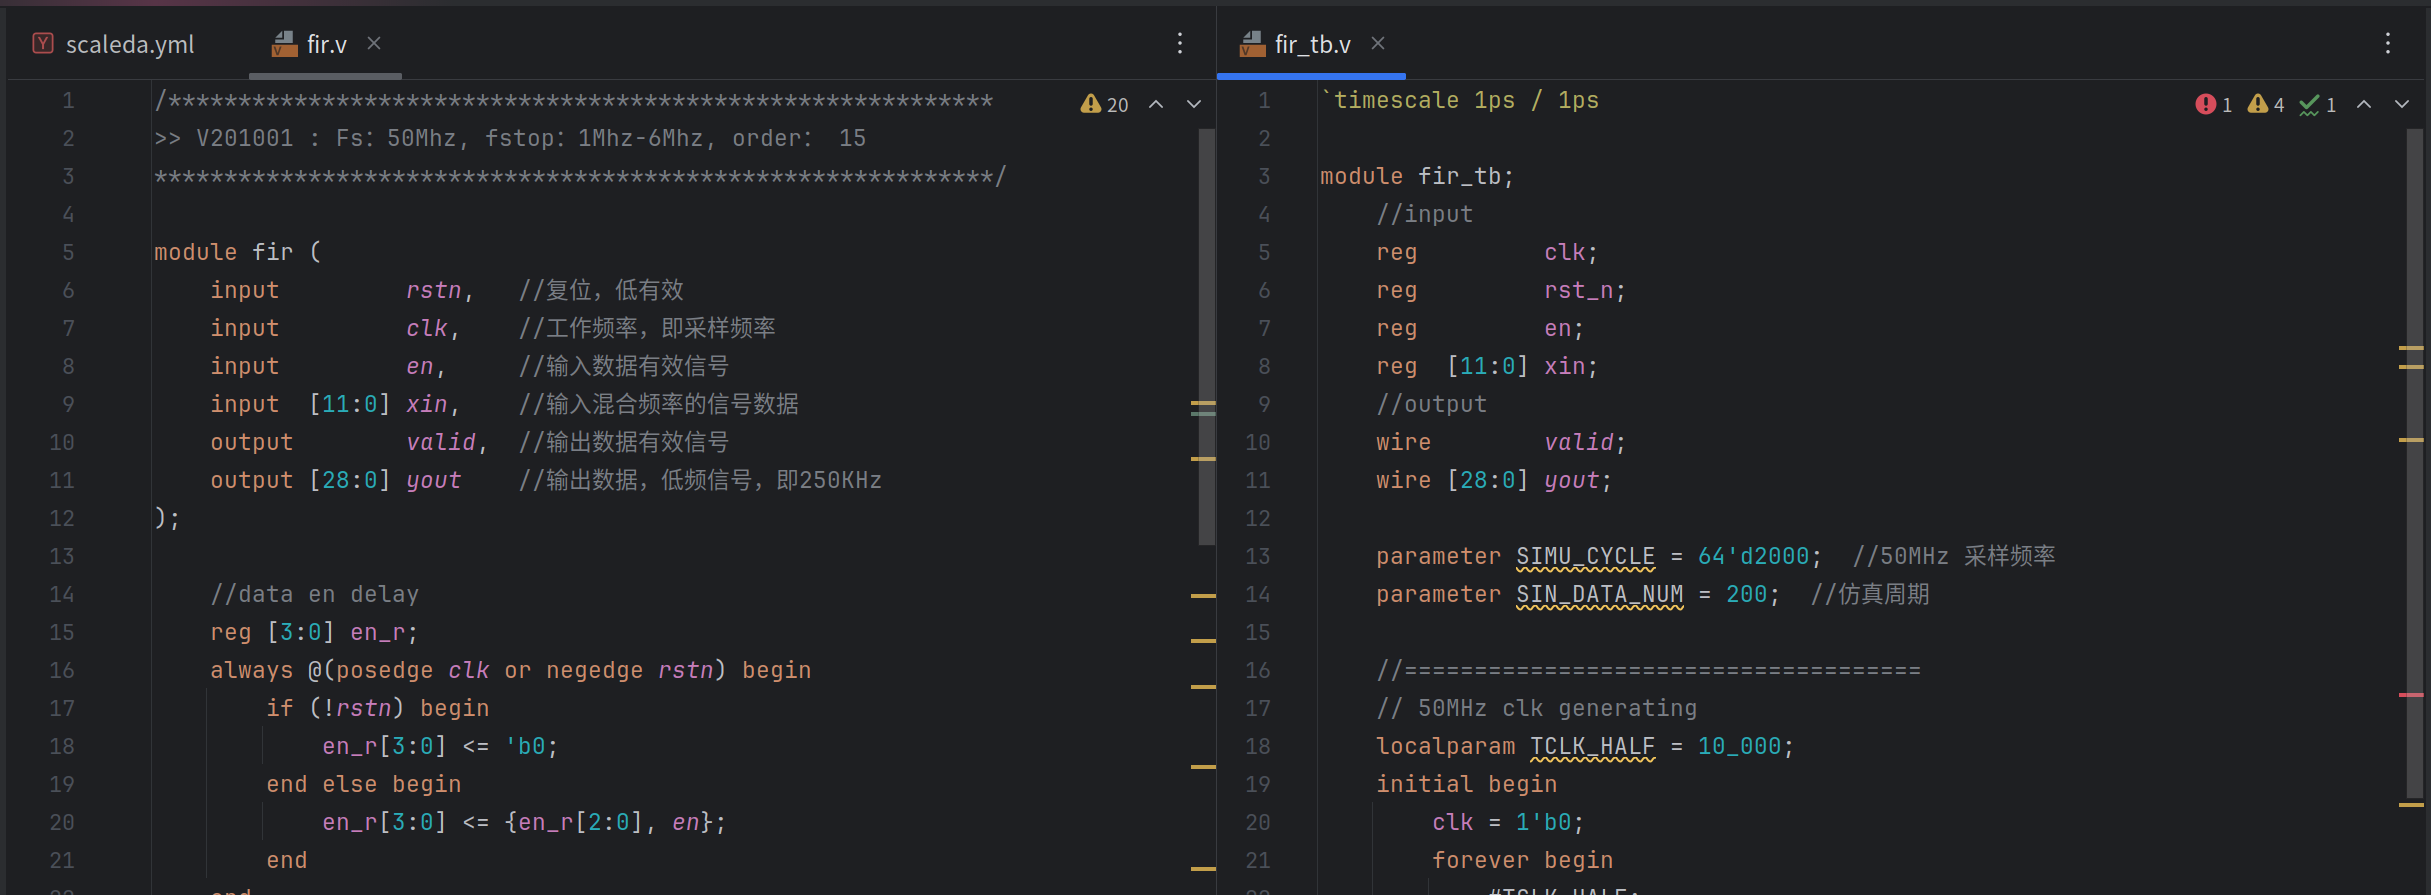
Right-click on the src folder → New → Verilog file. Enter the module name fir to create the fir.v file. Right-click on the test folder → New → Verilog file. Enter the test file name fir_tb to create the corresponding simulation testbench.
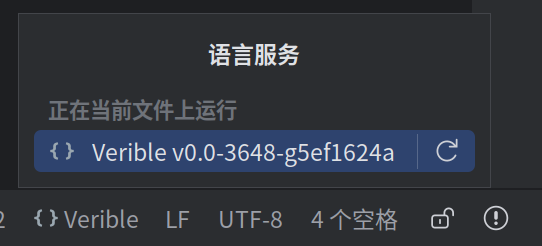
When opening a supported file, if you are using the paid version of IDEA, the language server will be started. Click the lower right corner to view the status of the language server or restart the language server. When switching running configurations, the language server automatically reloads file lists and other information.
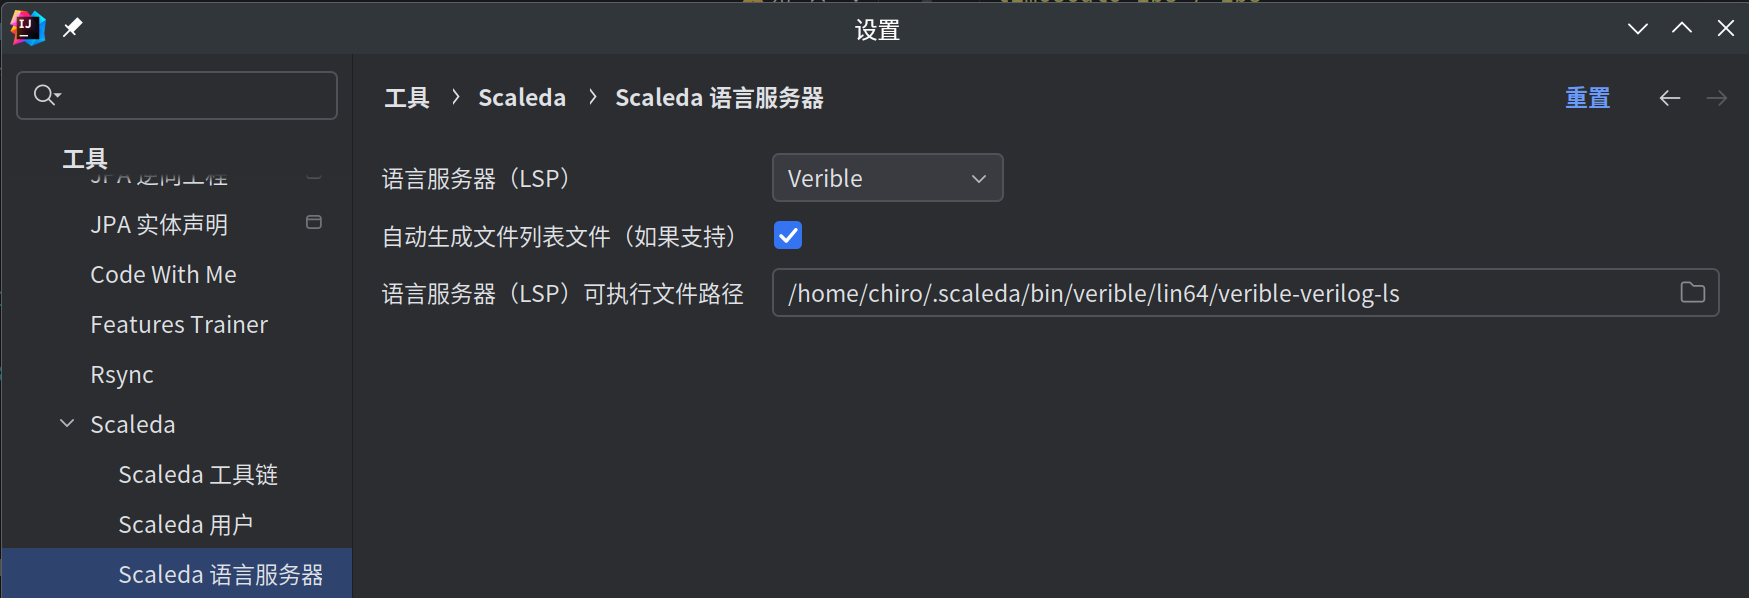
In Settings → Tools → Scaleda → Scaleda Language Server, you can adjust or switch the built-in language server, or set up a custom language server.
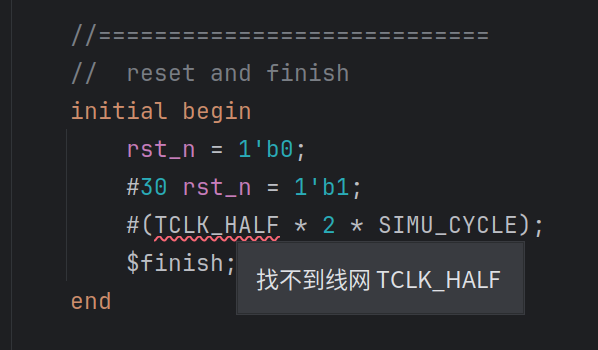
When editing HDL code, you can use code completion, syntax checking, and other functions provided by the language server and Scaleda’s built-in logic.
The current built-in HDL language support is still imperfect. If you encounter syntax parsing errors or code checking errors, you are welcome to raise them in GitHub Issues .
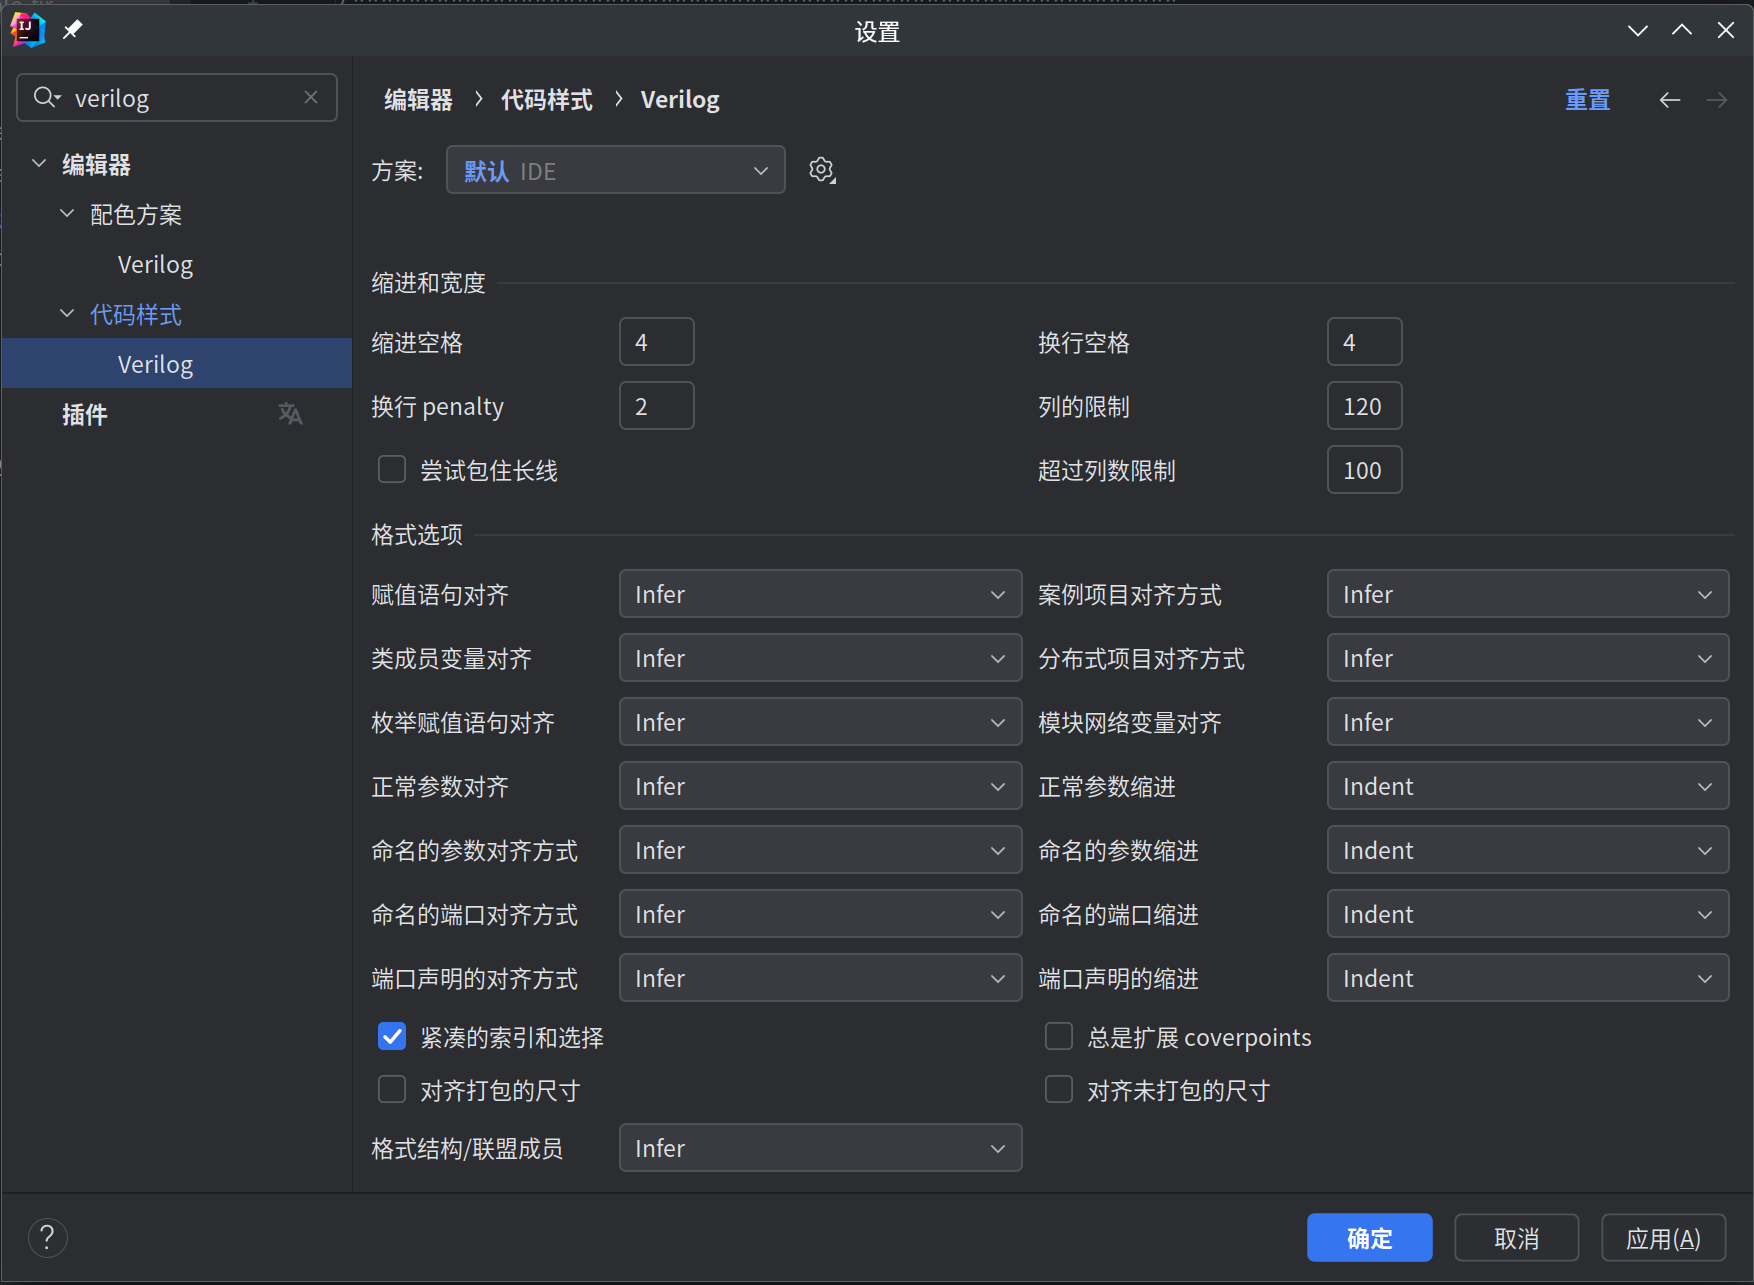
Scaleda provides Verilog / SystemVerilog code formatting capabilities through Verible, and formatting options can be adjusted in settings.
Add toolchain
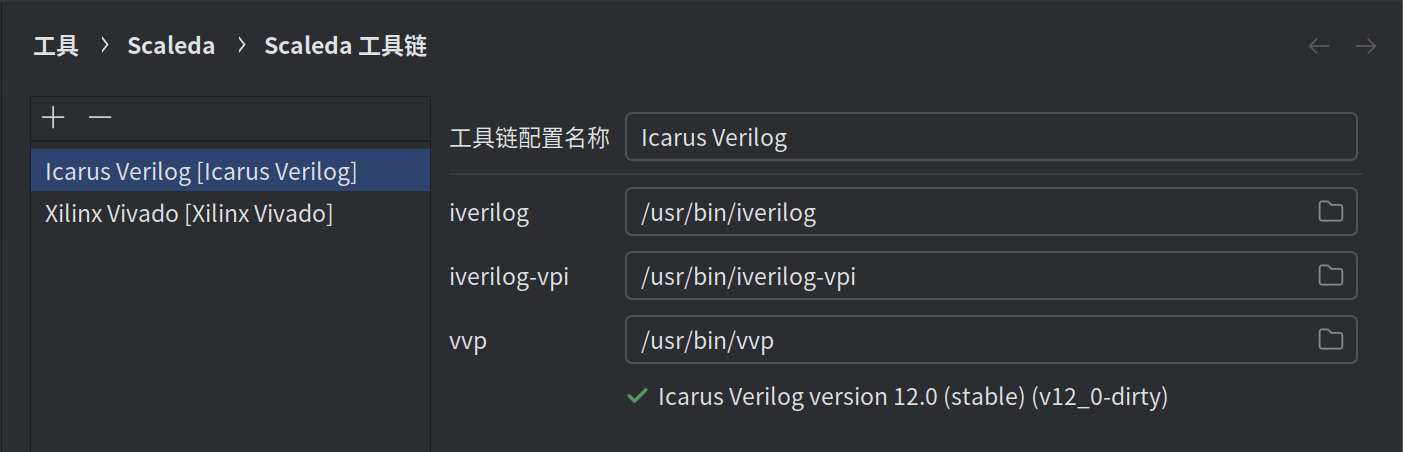
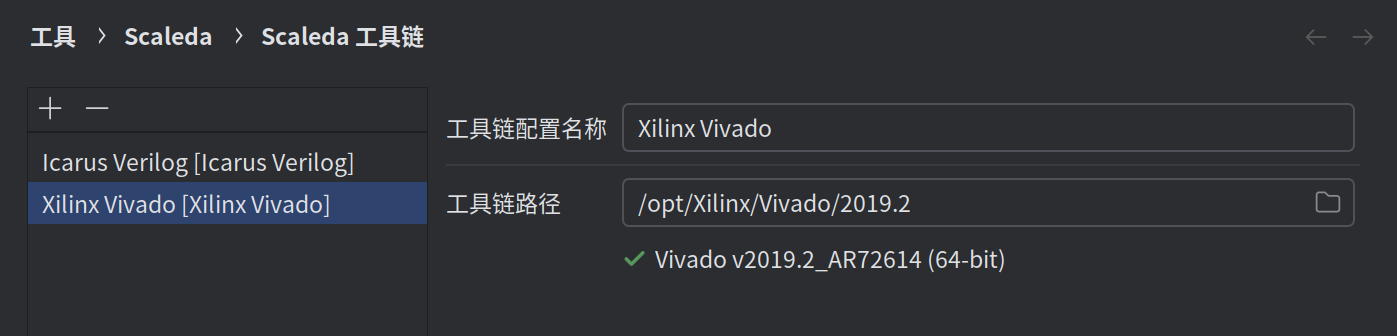
Before running the actual task, the toolchain settings need to be added in the global settings. Open Settings → Tools → Scaleda → Scaleda Toolchains and click the plus sign to add a toolchain. The two Icarus Verilog and Vivado toolchains added here are shown in the figure. If the supported toolchain is in PATH, Scaleda might automatically recognize and fill in the path. After completion, you can check whether the version and path of the tool chain are correct.
Add target platforms and tasks
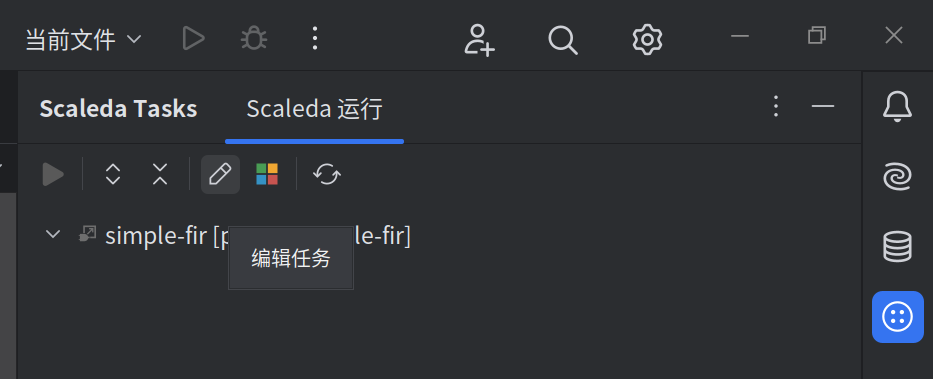
In the Scaleda task view in the upper right corner, click Edit Project to open the project editor to add toolchains and tasks.
Click the project tree root node, then click the plus sign in the upper left corner to add a target platform. Here select Icarus Verilog as the target platform for simulation and enter the platform name, then enter or click Select to set the top-level module.
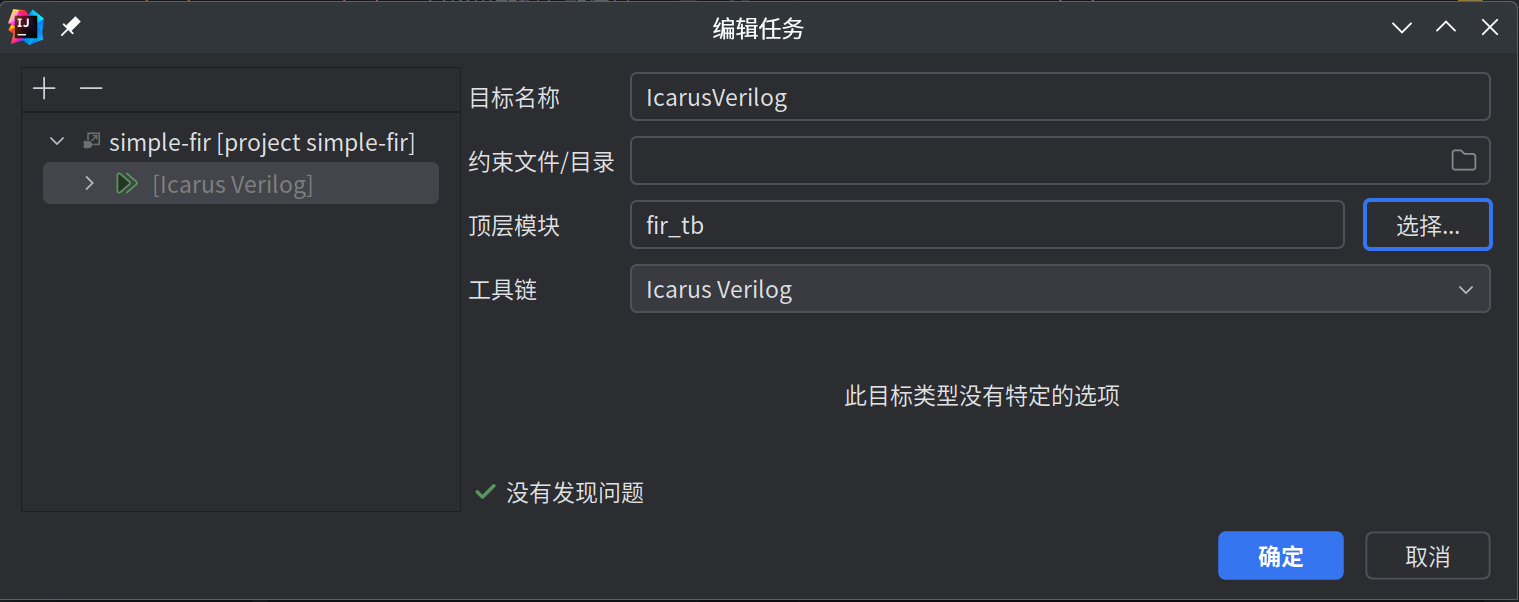
Click the target platform node again, then click the plus sign in the upper left corner to add a task. Select a simulation task here. It can be seen that since the upper-level target platform has selected the top-level module, the top-level module here will inherit the upper-level settings. If top-level modules are changed here, this task will override this setting.
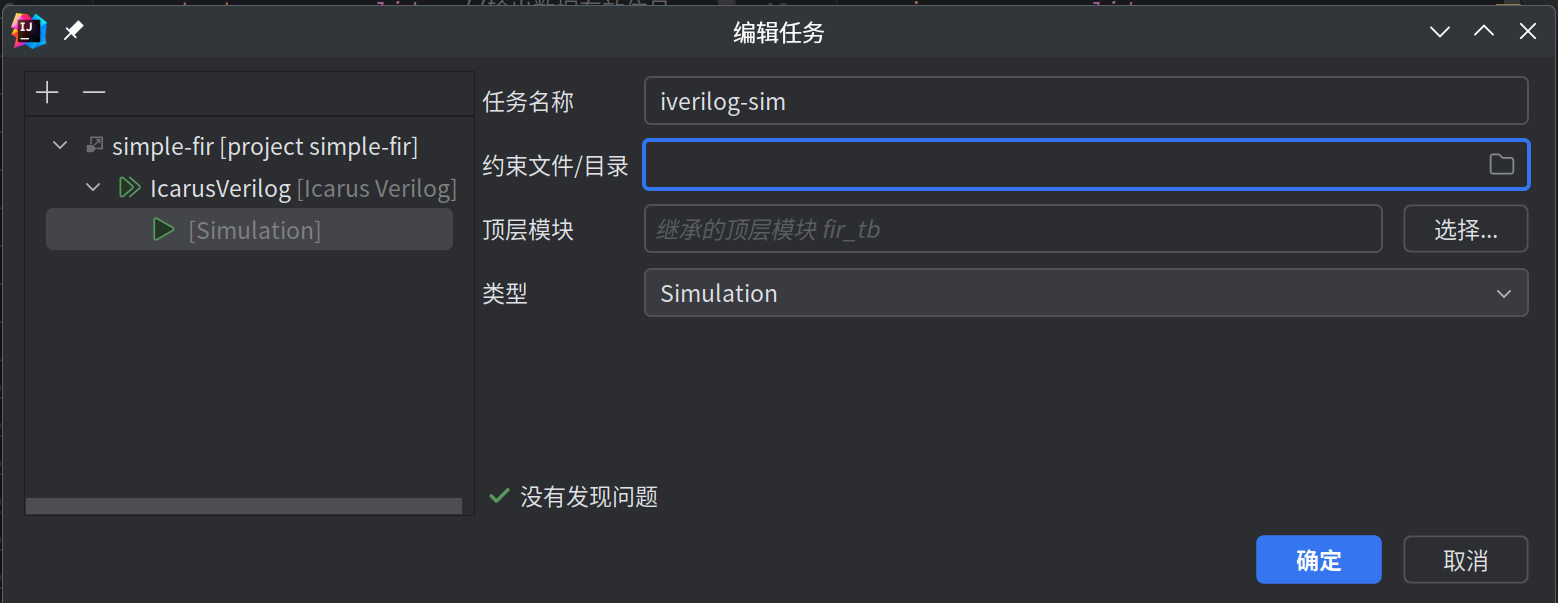
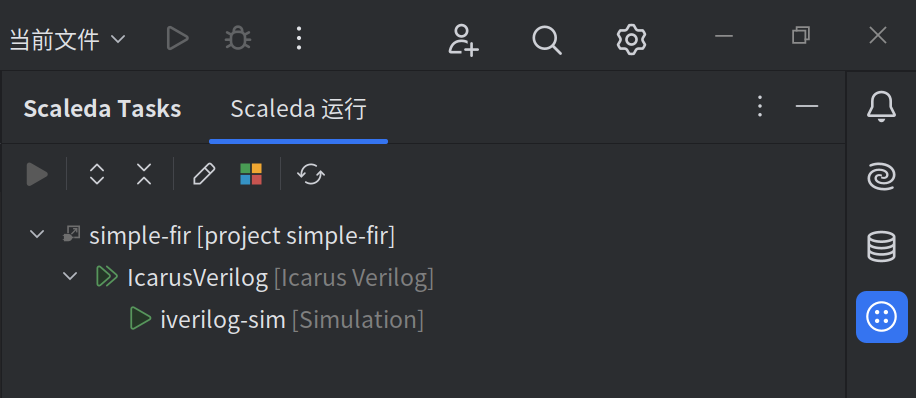
Click OK to save the current project configuration. After refreshing the project tree, you can see the newly added target platform and tasks.
Running an Icarus Verilog simulation task
At this time, double-click the simulation task just added. Scaleda will automatically run the simulation task and display the simulation results in the task output in the lower left corner.
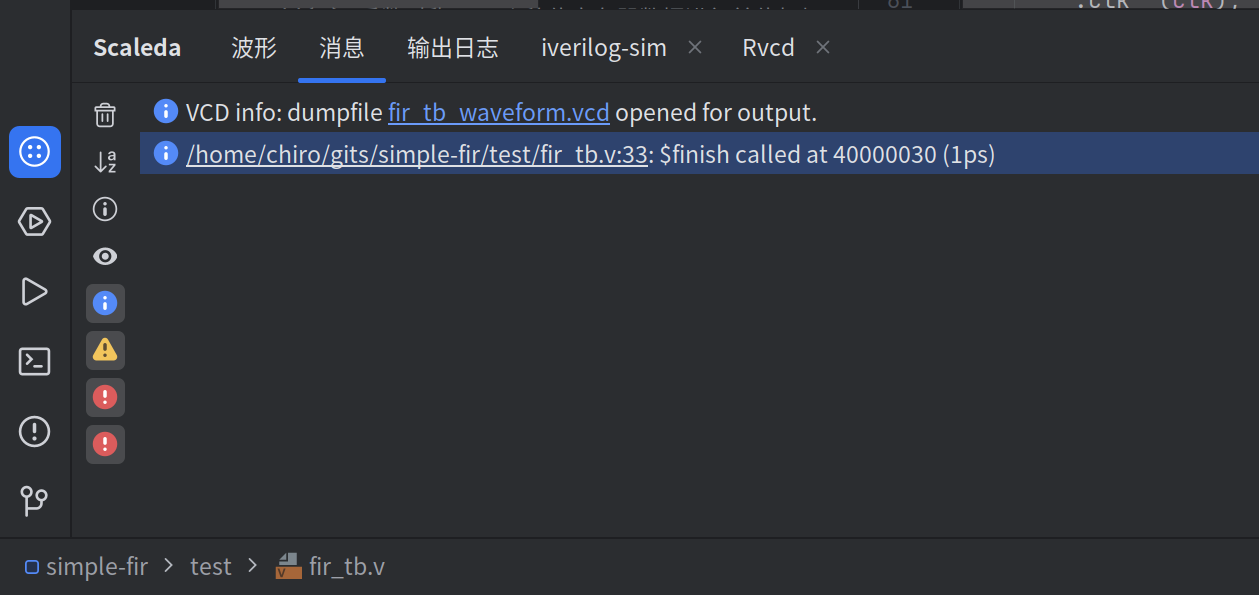
Since the automatic opening of the waveform viewer is set in the settings, Scaleda will automatically insert the waveform export code when simulating Icarus Verilog and automatically open the waveform viewer after the simulation is completed.
The inserted fir_tb_generated.v file is as follows:
`timescale 1ps / 1ps

module fir_tb;
initial begin
  $dumpfile("fir_tb_waveform.vcd");
  $dumpvars;
end
    //input
    reg         clk;
    reg         rst_n;
    // ...
The temporary files generated by this simulation task will be saved in the .sim/{target platform}-{task name} folder in the project root directory.
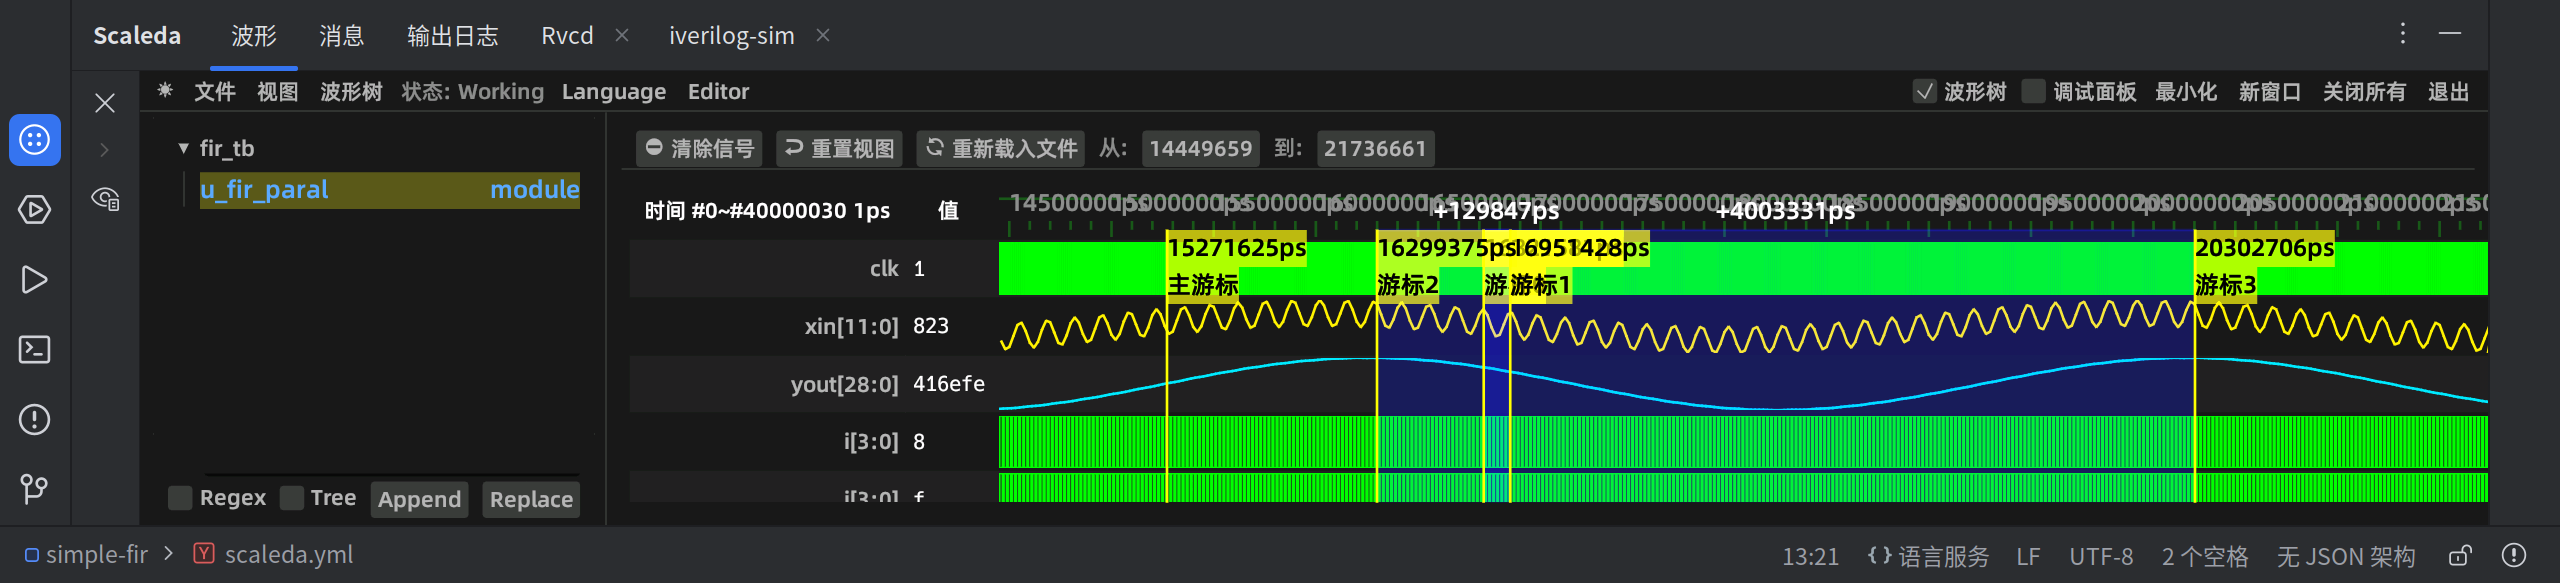
In the waveform viewer, add signals and set the display format to view the waveform graph.
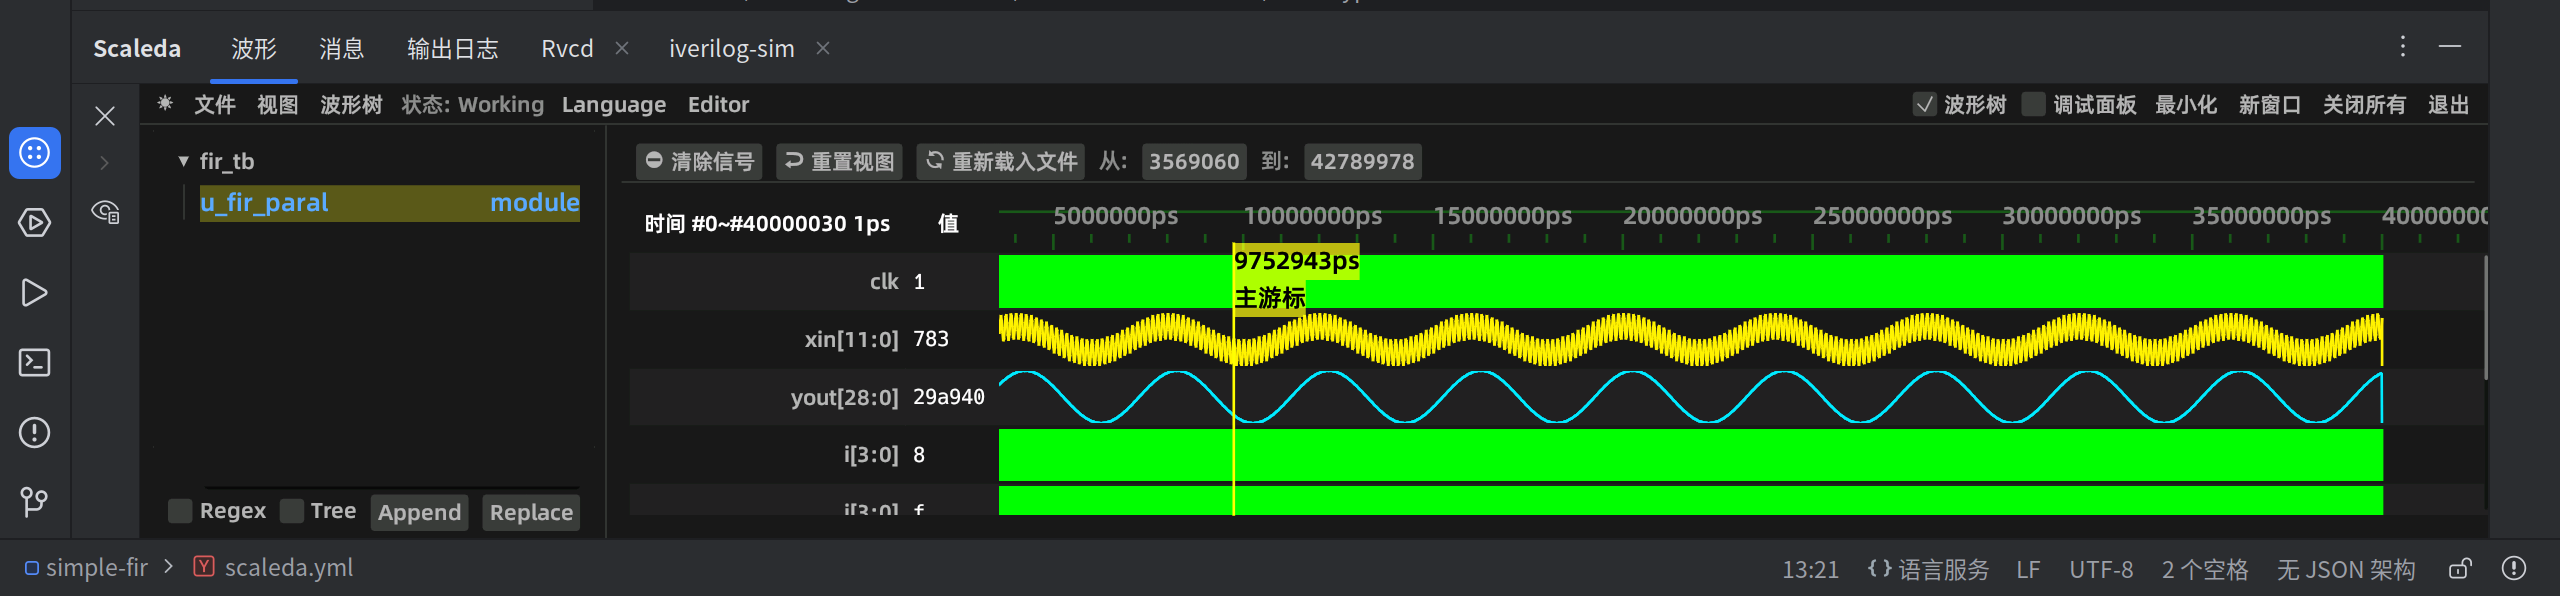
Use the mouse wheel, drag, zoom, right-click to drag to select the viewing range, etc., carefully observe the waveform and view the simulation results. If you encounter problems viewing in the embedded waveform window, you can also click the third button on the left toolbar to switch to an independent waveform viewer window.
Run Vivado tasks
💥Note: Currently only the Vivado 2019.2 version has been tested, and the other versions have not yet been tested!
Now that the simulation has passed, it’s time to synthesize and try it on the board.
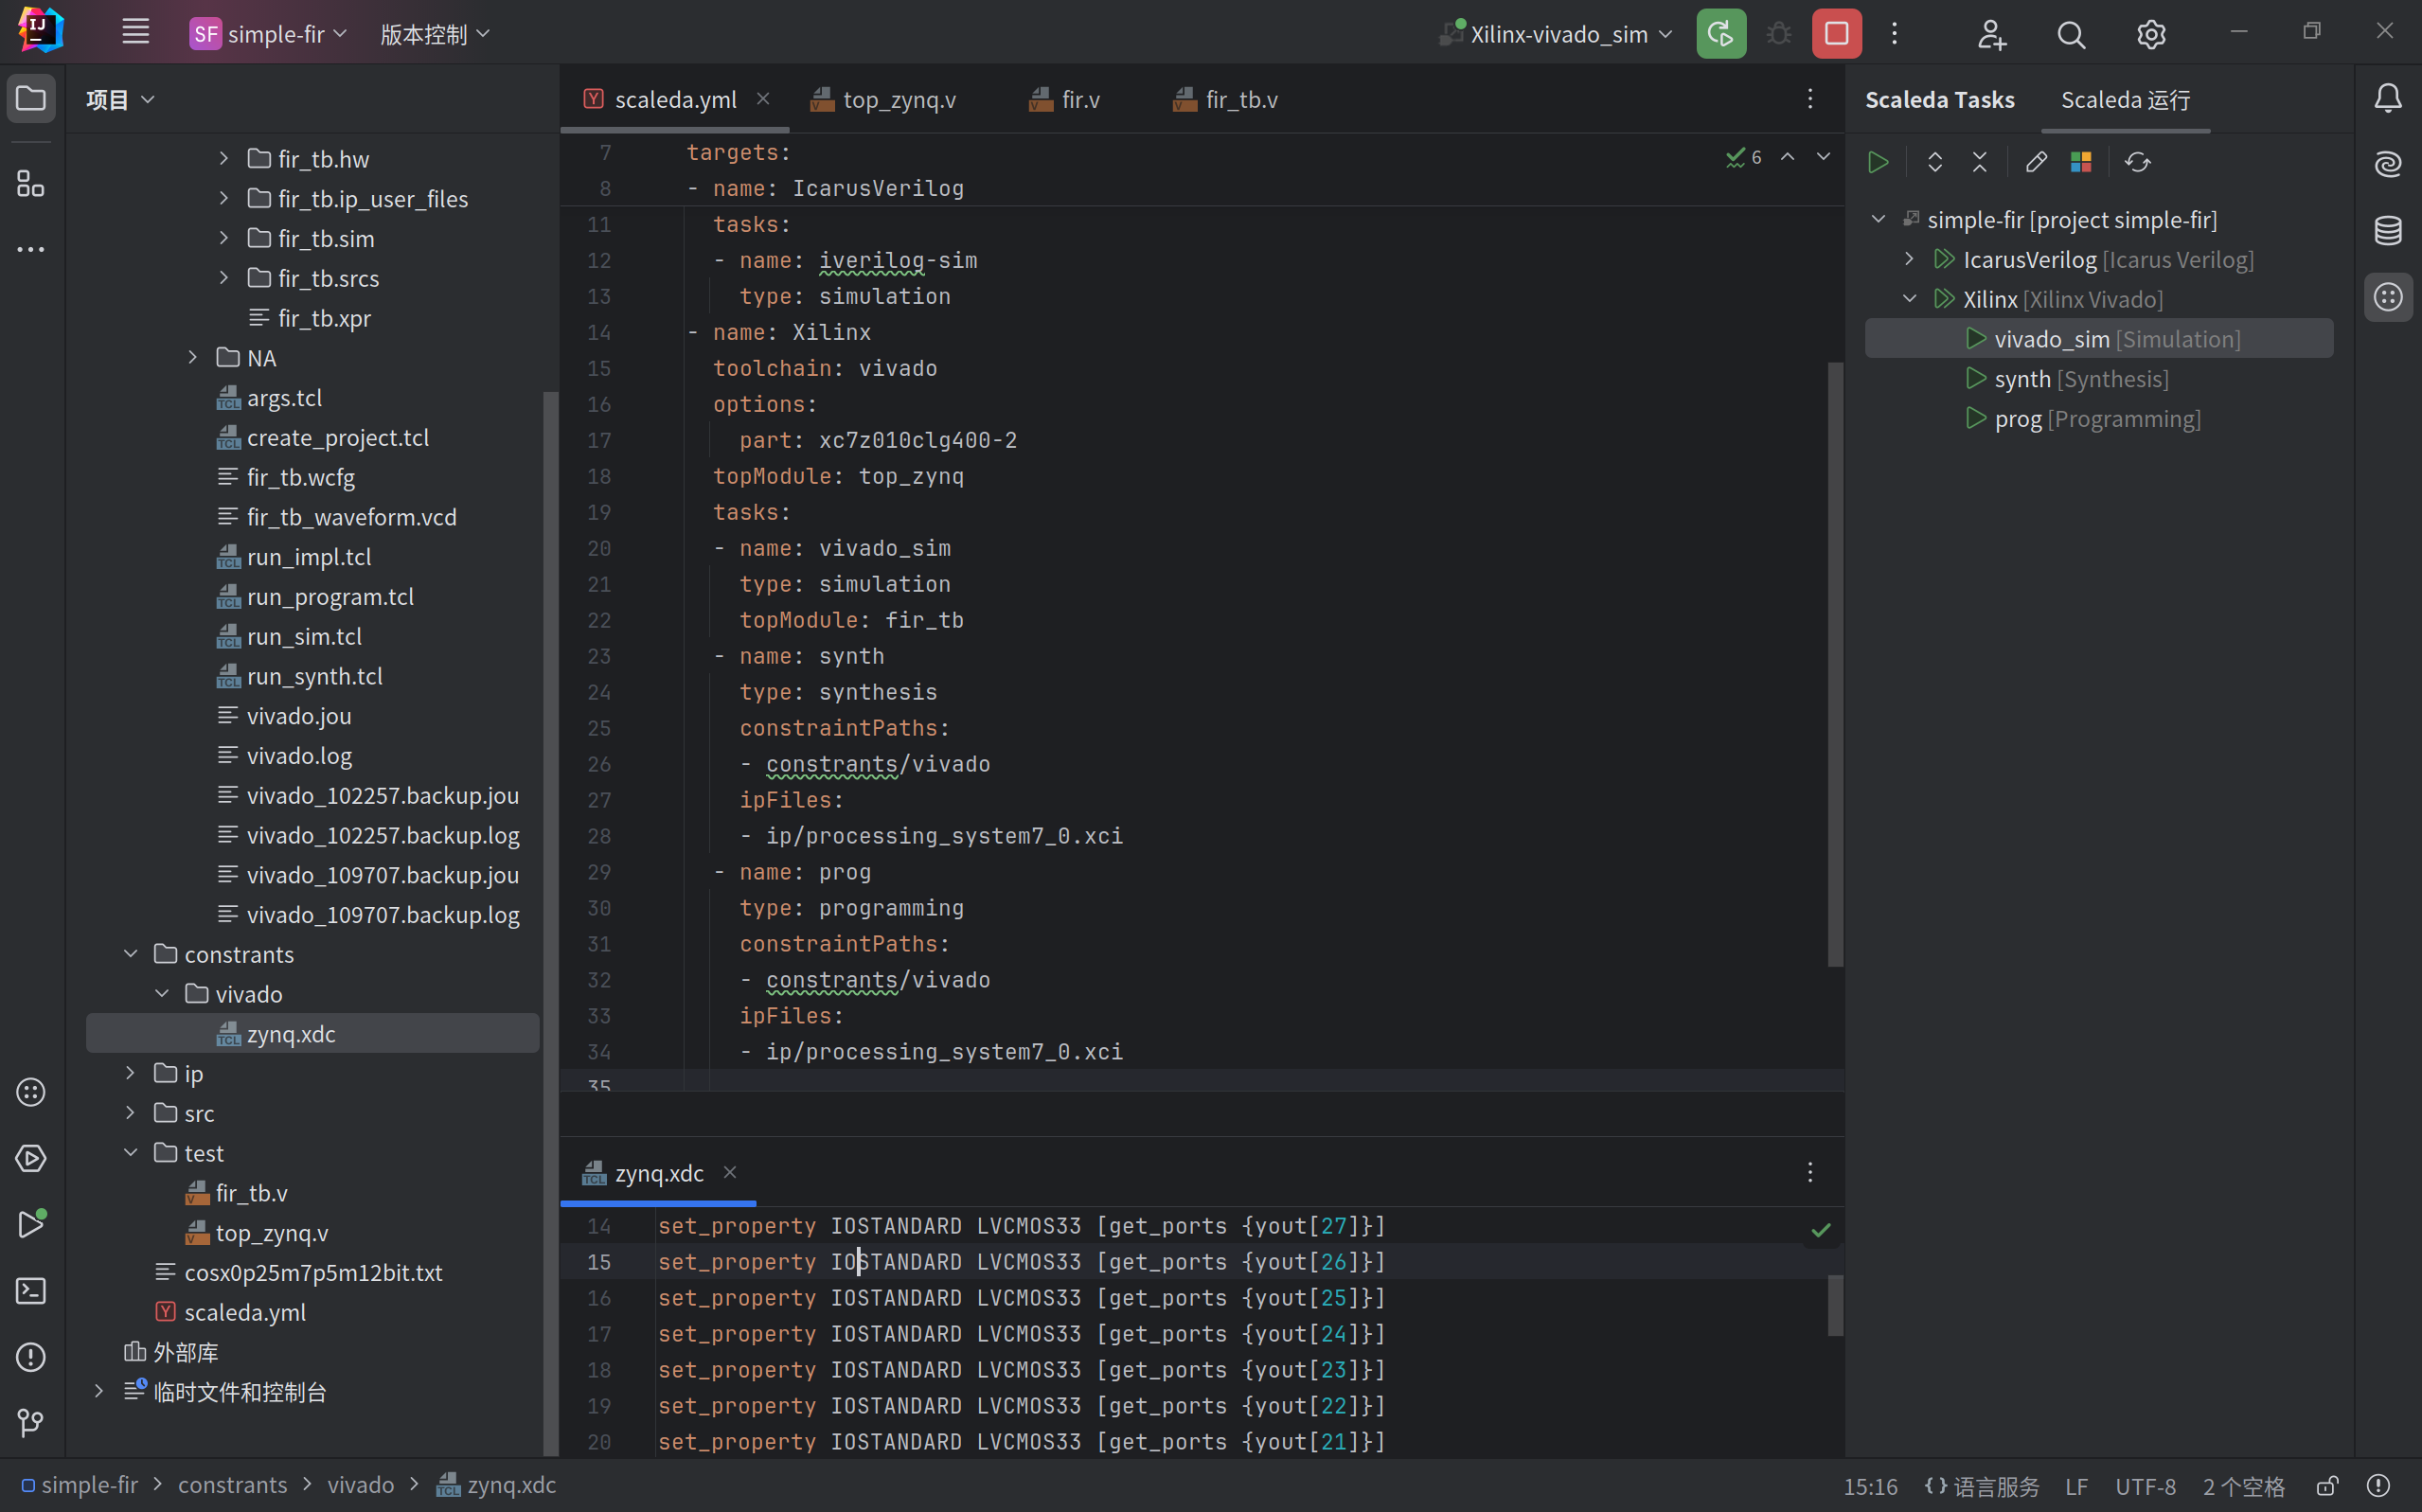
Add the Vivado target platform in the project editor, then add simulation, synthesis tasks and programming tasks, set device parameters, constraint files, IP core paths, etc. The added project structure and constraint files are as follows:
Double-click the Vivado simulation task to call Vivado Simulator to simulate and view the simulation results.
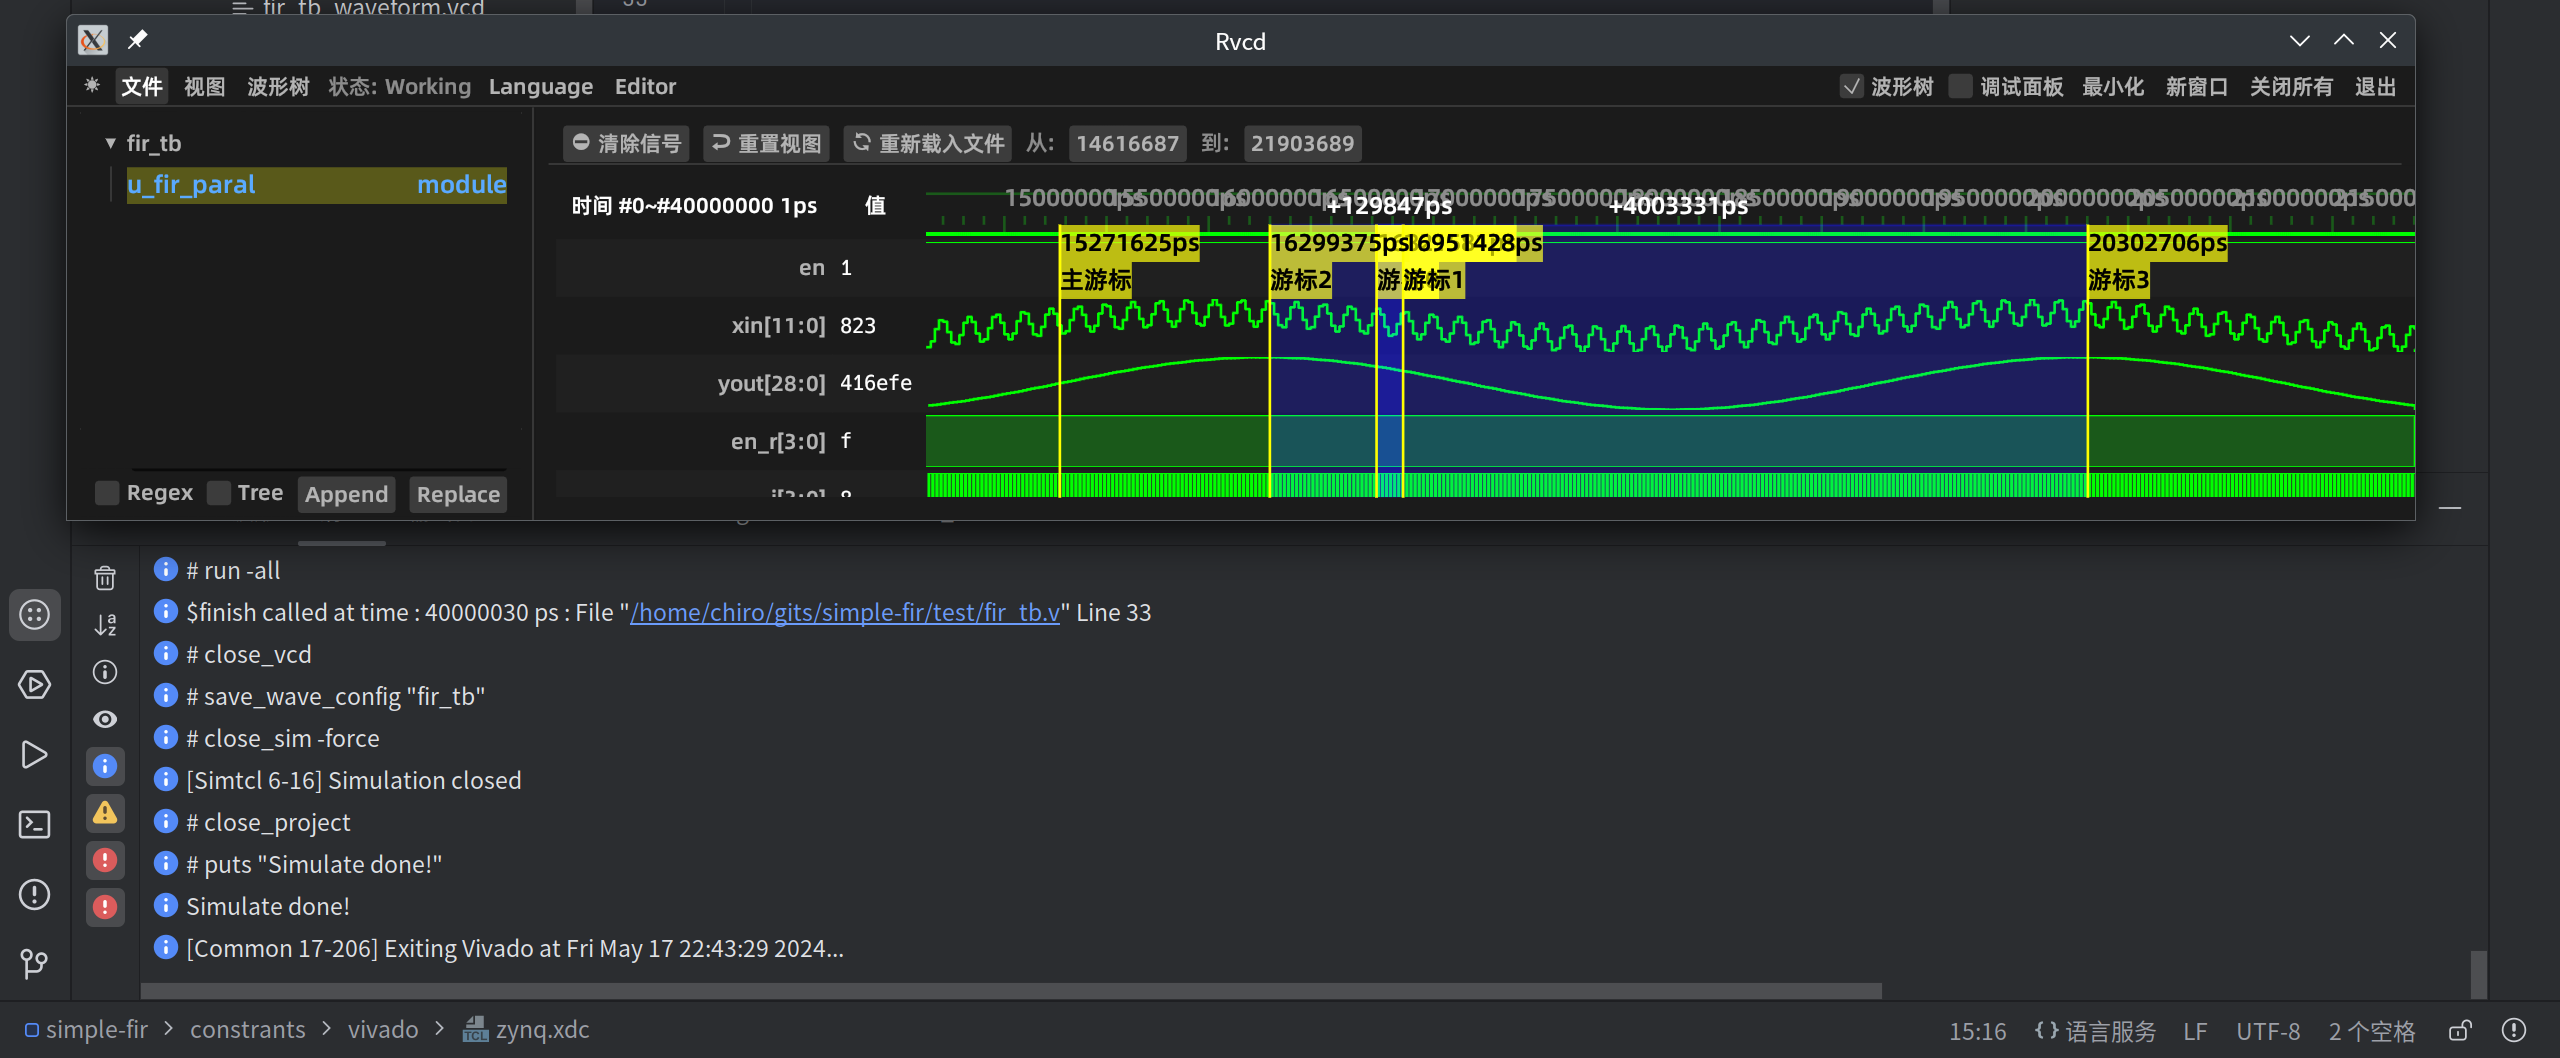
It can be seen that the Vivado Simulator simulation results are consistent with the Icarus Verilog simulation results.
Since the example device used here is Zynq7010 and there is no clock pin on the PL side, a processing_system7_0.xci IP core is added here to provide the clock signal. This IP core can be exported after Vivado generation.
Added top-level modules for Vivado synthesis:
module top_zynq (
    input  [11:0] xin,    //输入混合频率的信号数据
    output        valid,  //输出数据有效信号
    output [28:0] yout    //输出数据
);
    wire clk;
    wire rst_n;
    processing_system7_0 u_zynq (
        .FCLK_CLK0(clk),
        .FCLK_RESET0_N(rst_n)
    );
    fir u0 (
        .rstn(rst_n),
        .clk(clk),
        .en(1'b1),
        .xin(xin),
        .valid(valid),
        .yout(yout)
    );
endmodule
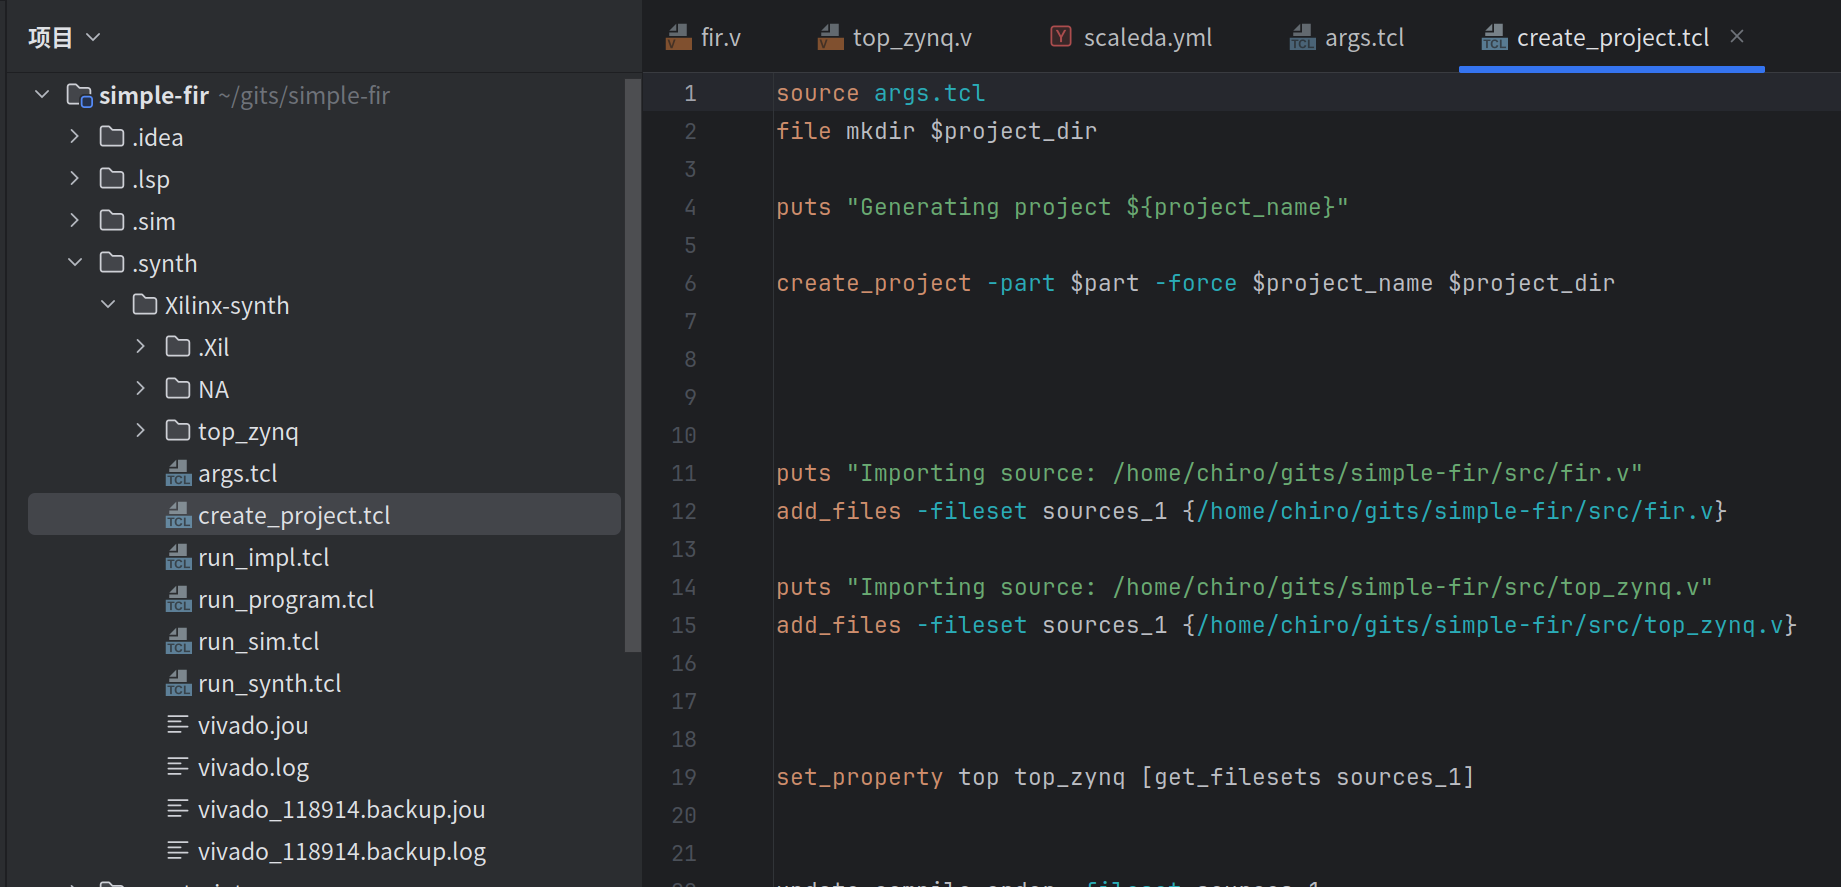
After double-clicking to run the synthesis and programming tasks, independent Vivado projects will be generated in the .synth and .impl folders. While you wait for synthesis and implementation to complete, you can view the generated Tcl scripts, run logs, and more.
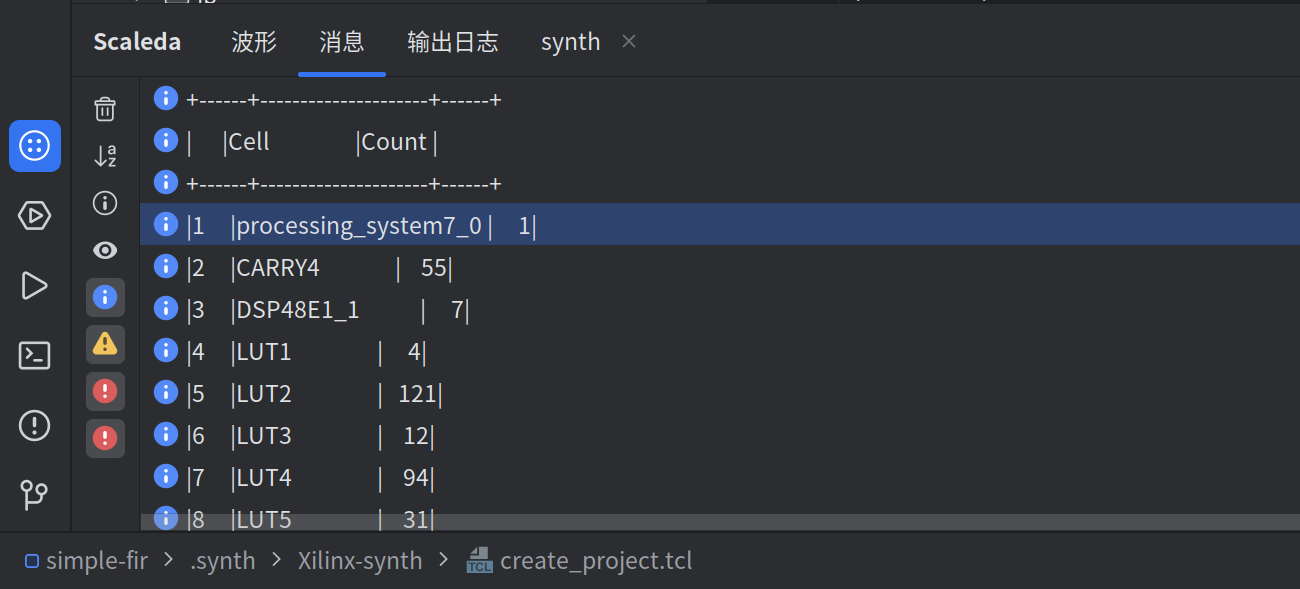
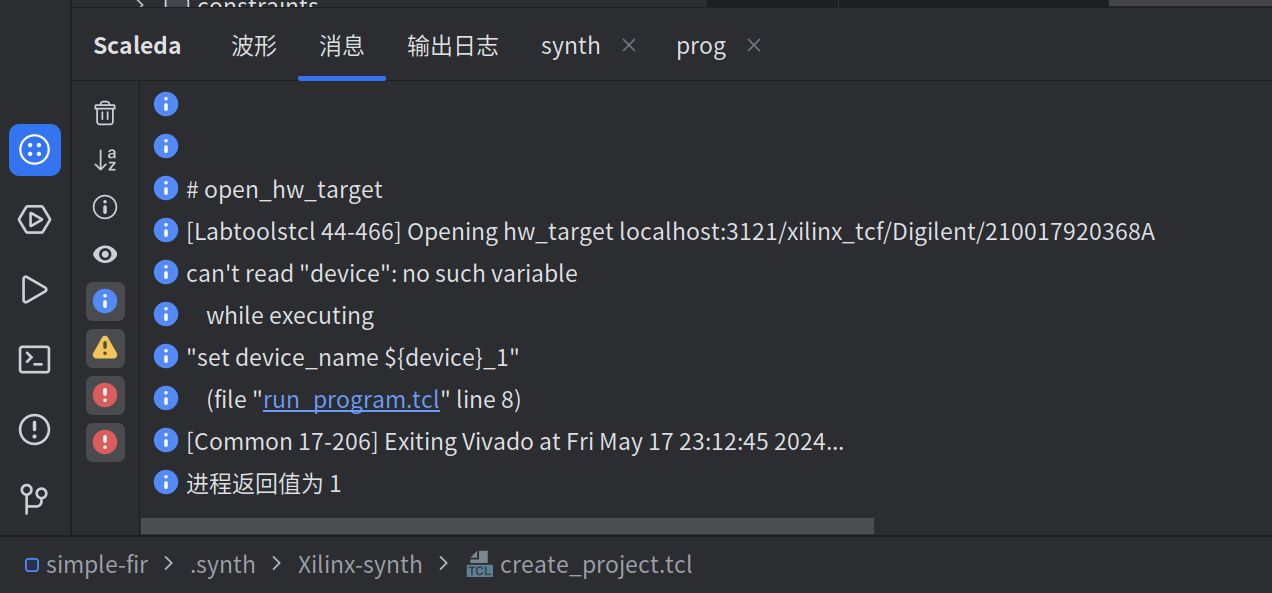
The output results of the synthesis and programming tasks are as follows. You can see a brief timing report after success. The programming task will complete the complete synthesis and implementation process and directly download the bit stream to the connected development board. If there is a problem that cannot be solved directly, you can also use Vivado to open the corresponding .syth/{target platform}-{task name} or .impl/{target platform}-{task name} folder in the project to view details. Comprehensive or implementation report. It should be noted that each time the task is run, a new Vivado project will be created, so if you need to modify and test, you can copy the Vivado project first.
Run other tasks
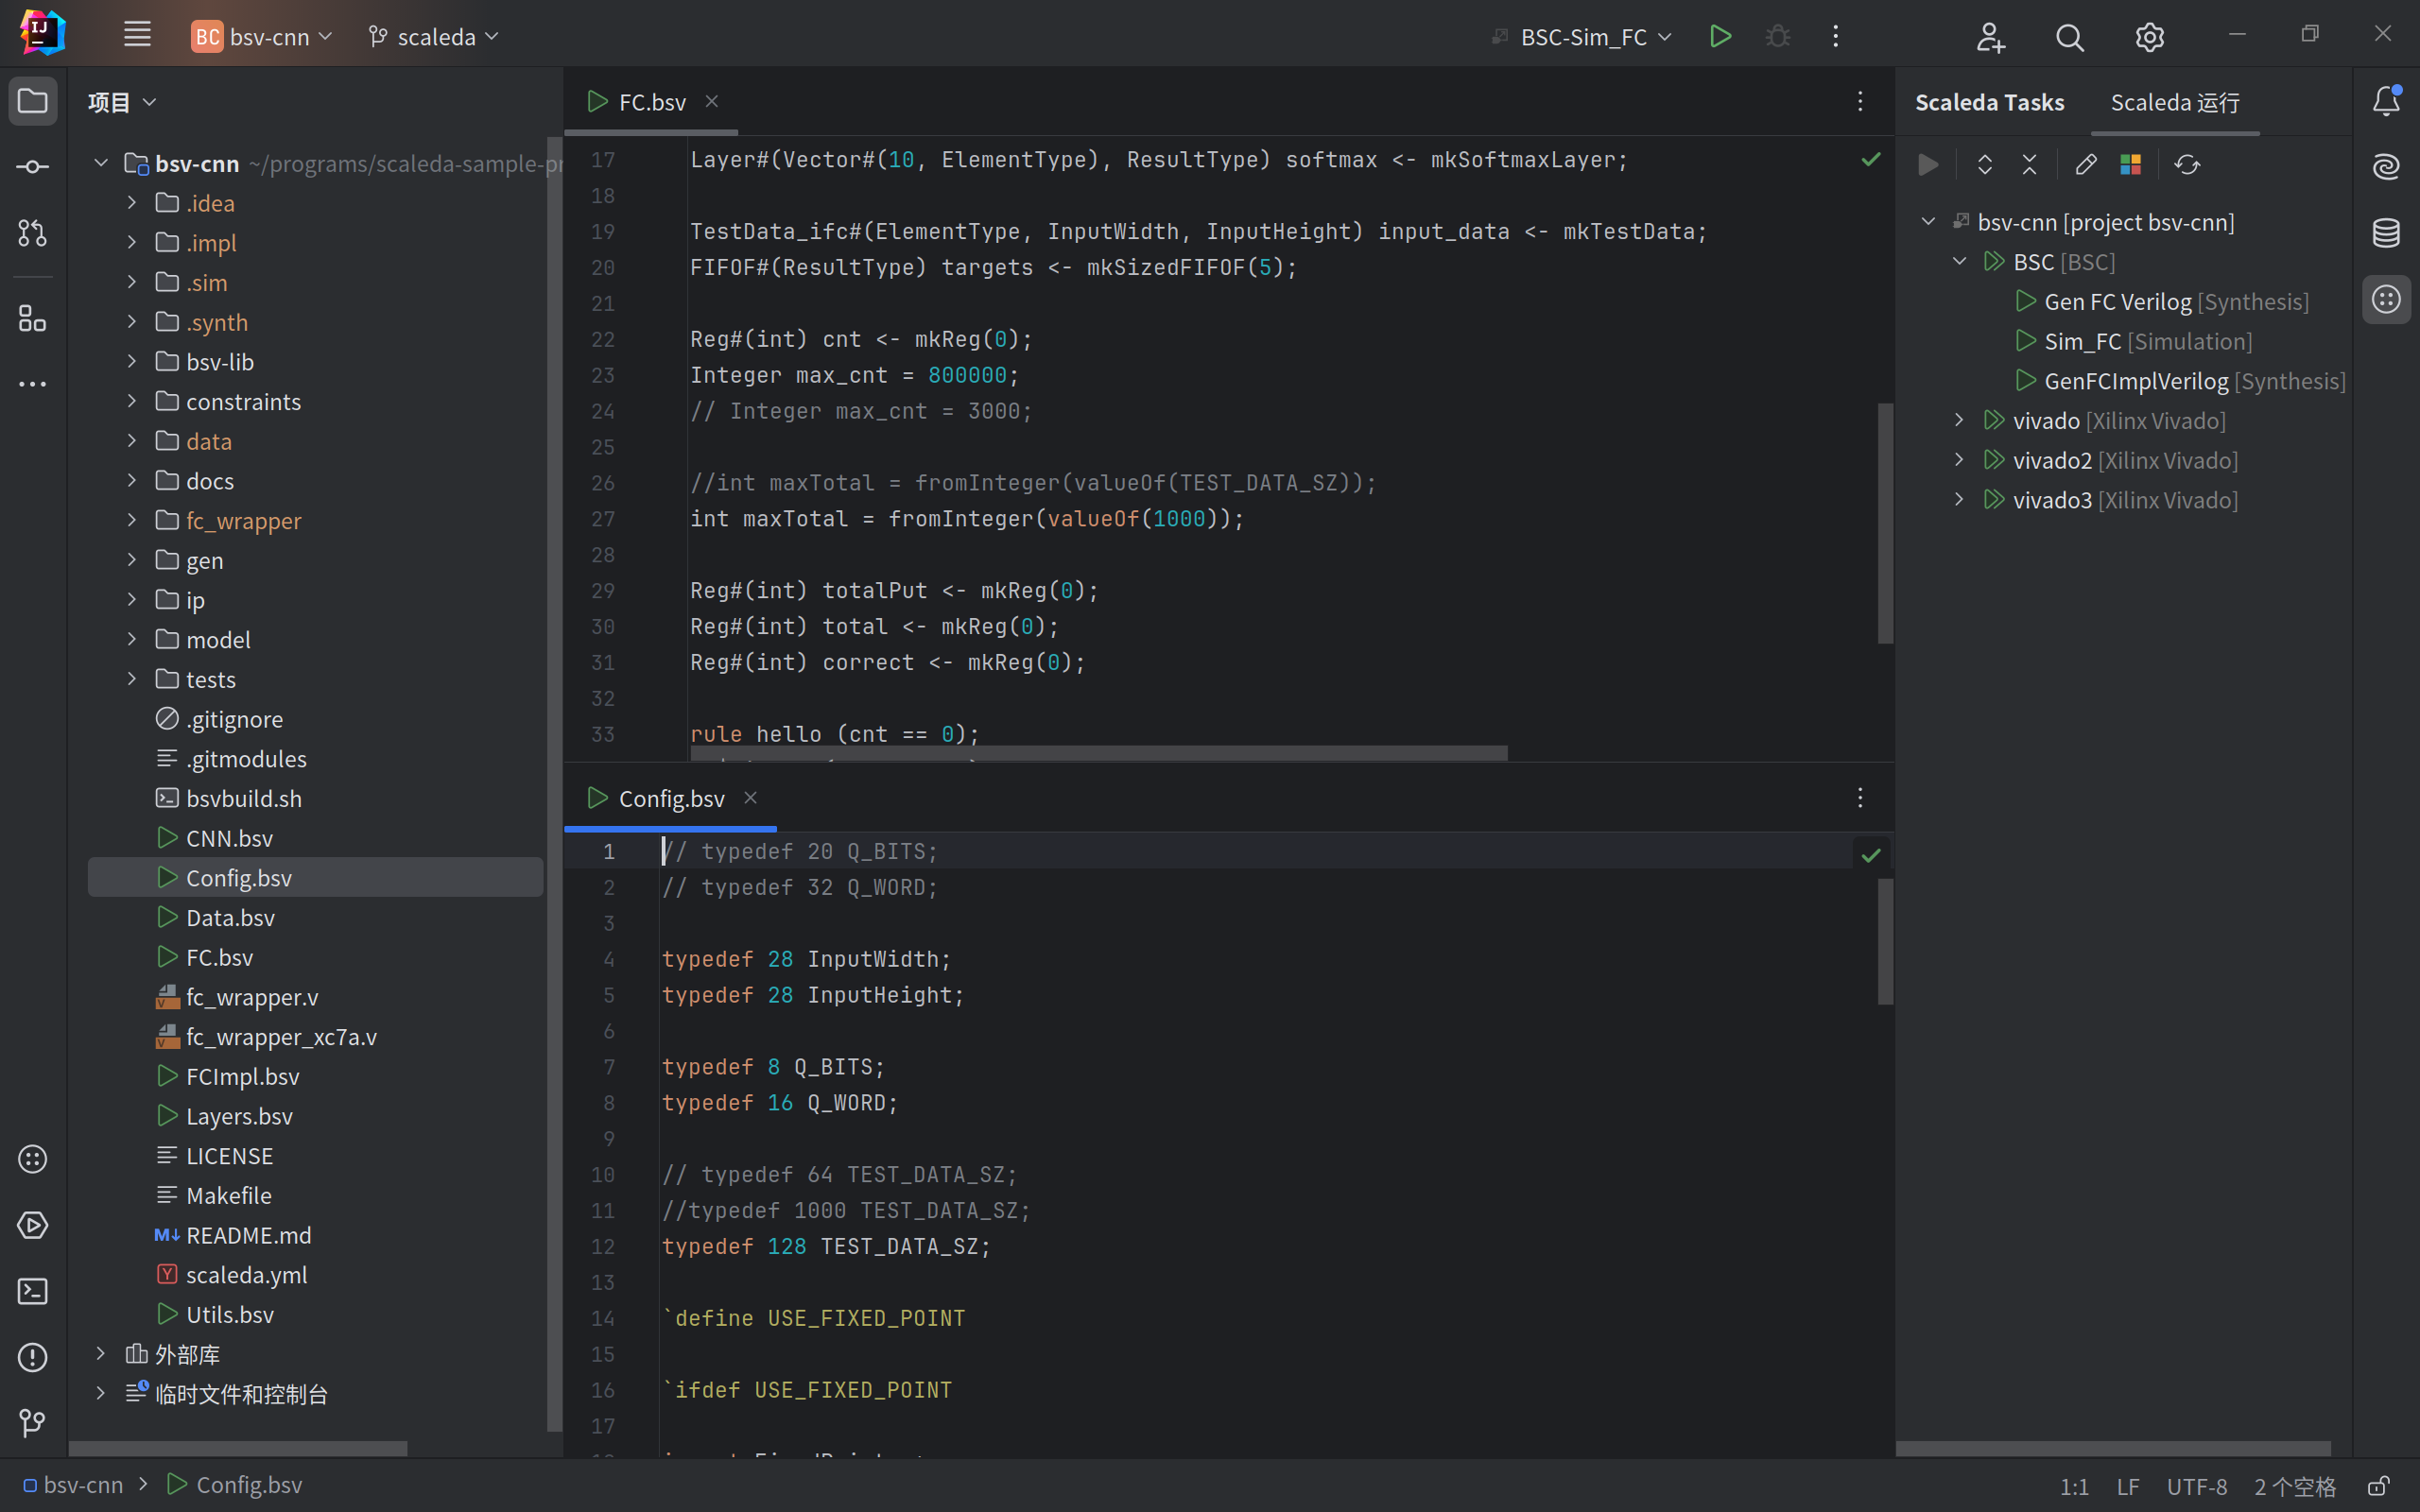
Scaleda currently also supports tool chains such as Yosys, Quartus Prime, Bluespec Compiler, etc. The usage is similar to Vivado. You can try to add these tool chains and run tasks. A sample project using Bluespec Compiler is shown below:
Run remote tasks
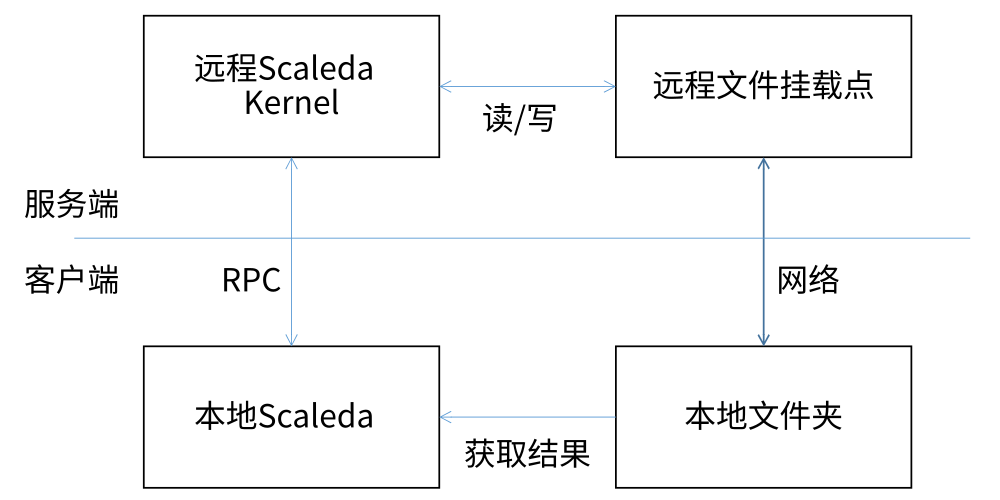
If your computer performance is insufficient, or you do not have a local tool chain and need to run tasks on a remote server, you can use Scaleda’s server mode.
💥NOTE: This feature is still under testing! The current implementation may have various performance and compatibility issues during runtime.
(Optional) Generate and set JWT parameters on the server:
# RSA 公钥和私钥
export JWT_RSA_PUBLIC_KEY=...
export JWT_RSA_PRIVATE_KEY=...
# 启用 JWT 认证
export AUTH_ENABLE=1
# 上述环境变量也可以写在执行目录下的 .env 文件中,不需要 export 命令
Then start the server:
$ alias scaleda='java -jar /path/to/scaleda-kernel.jar'
# 查看帮助
$ scaleda --help
# 启动服务器
$ scaleda remote serve
23:21:24.212 [main] INFO  scaleda-kernel - [ScaledaShellMain.scala:78 main] This is Scaleda-CLI, an EDA tool for FPGAs
23:21:24.568 [main] INFO  scaleda-kernel - [ScaledaShellMain.scala:105 main] No project config detected!
23:21:25.014 [server-main-rpc-server-thread] INFO  scaleda-kernel - [RpcPatch.scala:59 getStartServer] scaleda grpc server serve at port 20051
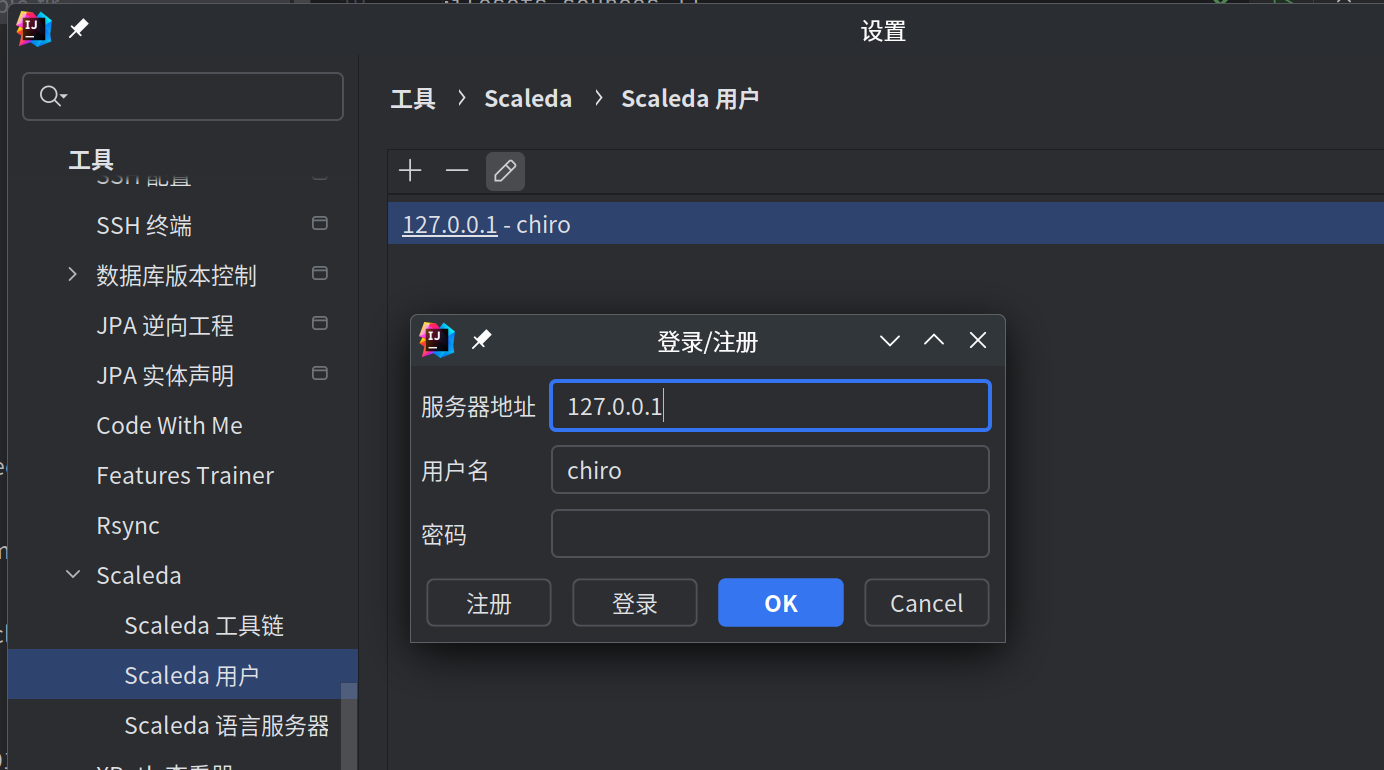
In the client’s IDEA settings, go to Tools → Scaleda → Scaleda Users, click the plus sign to create new credentials, then log in and register in the login window. The user’s login credentials are saved in the server’s database, and the client only saves a token, which is used to verify the user’s identity.
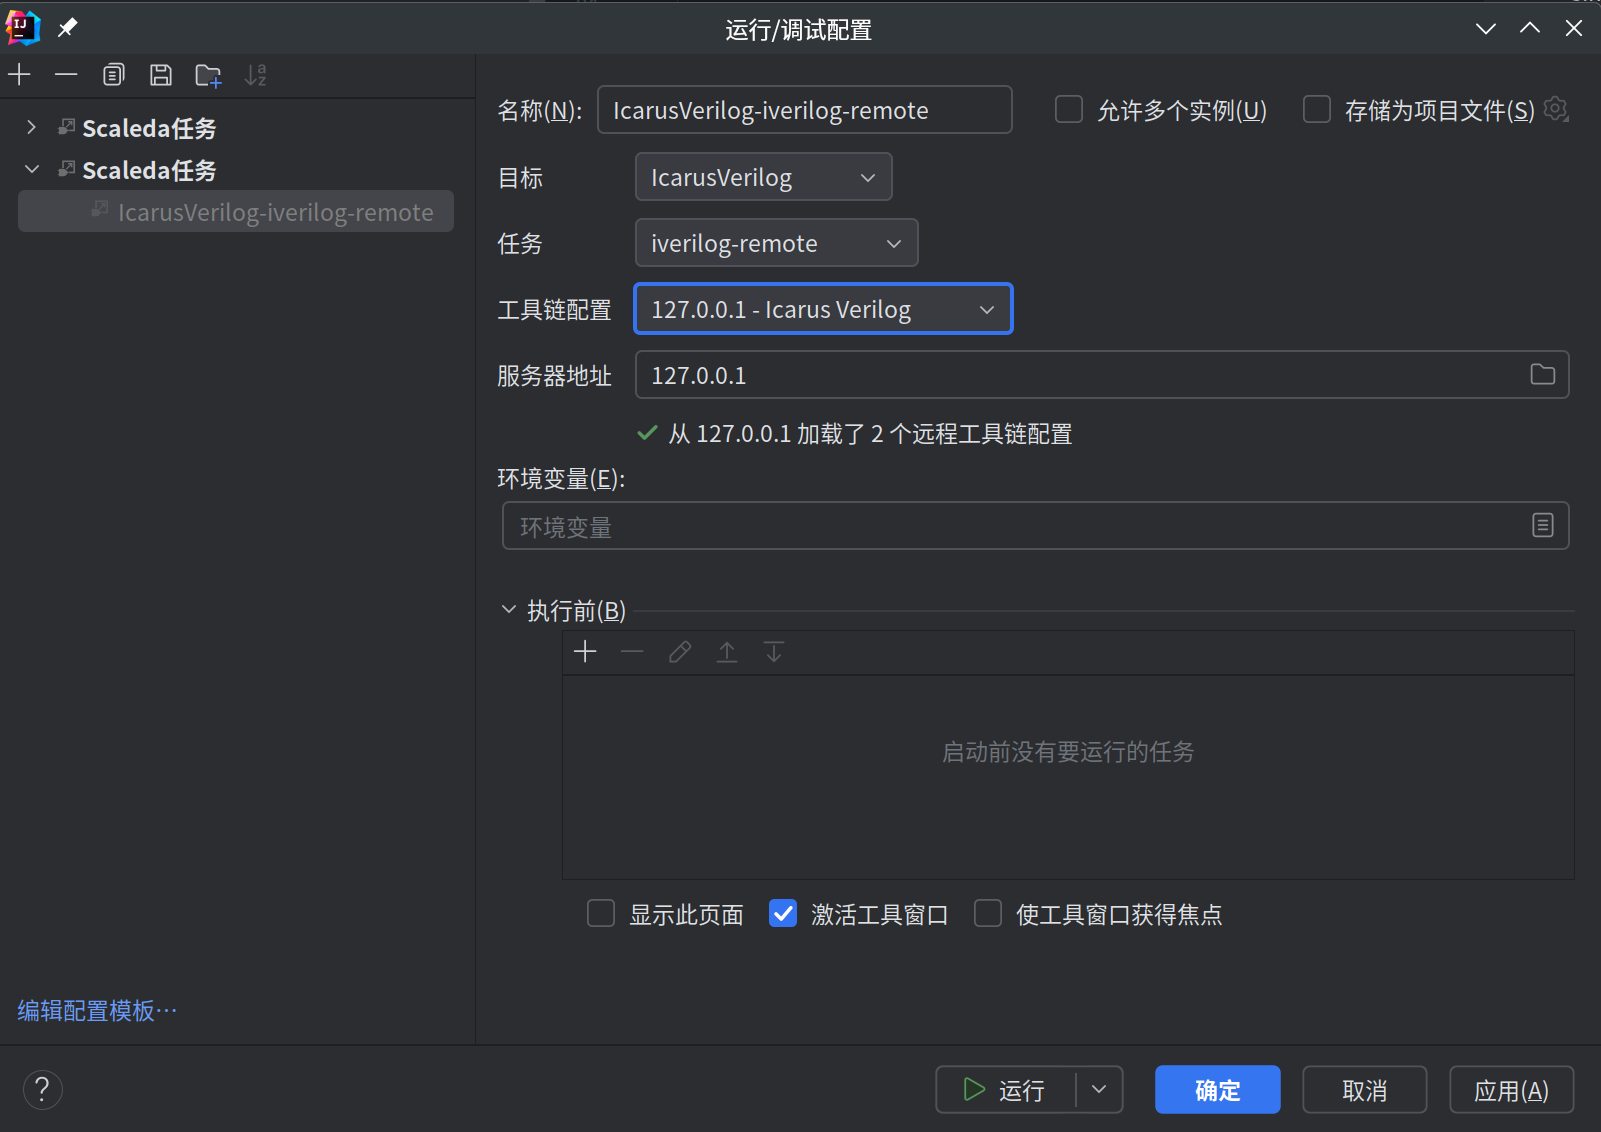
First create a new task (or reuse a previous task), double-click to create a run configuration in IDEA format, edit the run configuration, specify the server and remote tool chain, and then run the task.
The principle is roughly that the server mounts a client’s file system through the gRPC network channel, and replaces the text of the configuration path, file content, output data, etc., so that the entire project can be run without uploading to the server and the remote task can be performed. Basically the same as local execution.